
Here at thinkWhere we’ve recently been working with the automation tools in QGIS. The processing toolbox is a much underrated feature in QGIS, lacking the jazzy graphics of the ArcGIS equivalent it is, however, just as useful and functional from the point of view of doing multi-stage GIS analysis.
We recently had occasion to create a tool for a client that counted the number of features within a polygon and provide statistics for subsets of the features. Let’s try this again, for the sake of demonstration and talk about trees.
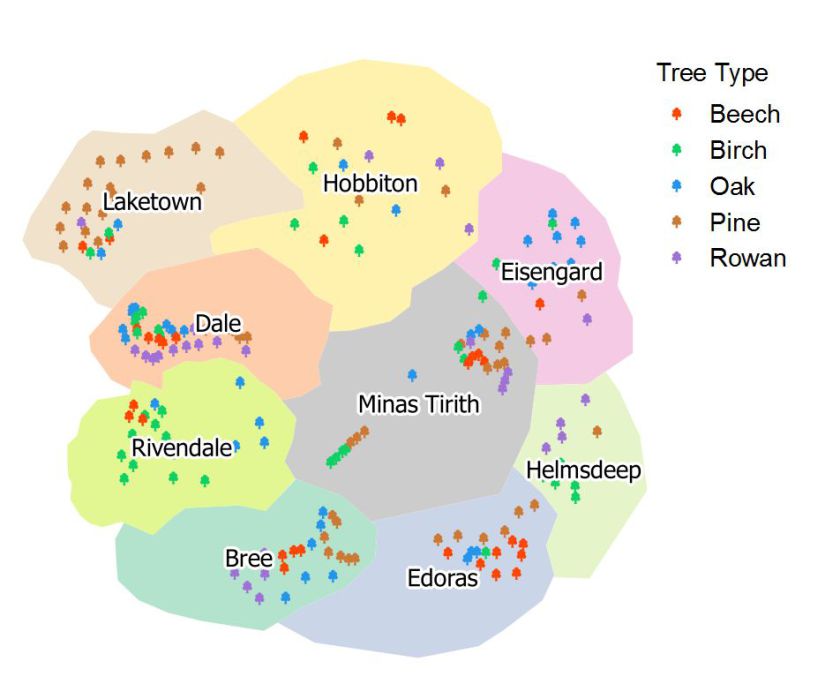
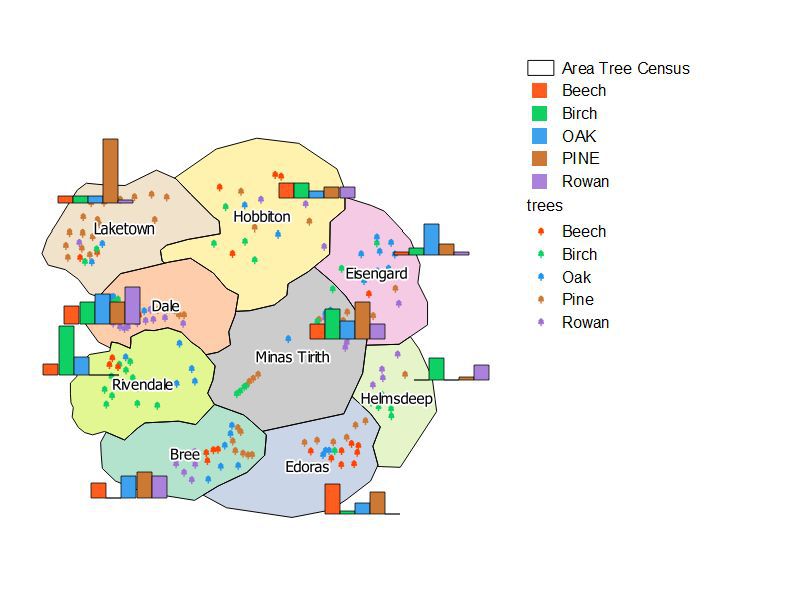
Here we have a series of suburbs arranged as polygons and trees as points. As you can see there are 5 types of tree in the dataset. A Spatialite or PostGIS database would make quick work of this, but you can also use the QGIS processing toolbox to iterate through this and count each aspect of the data.
Effectively from the point dataset we need to extract each of the attributes.
Extract by Attribute from Trees “Type = Beech” etc.
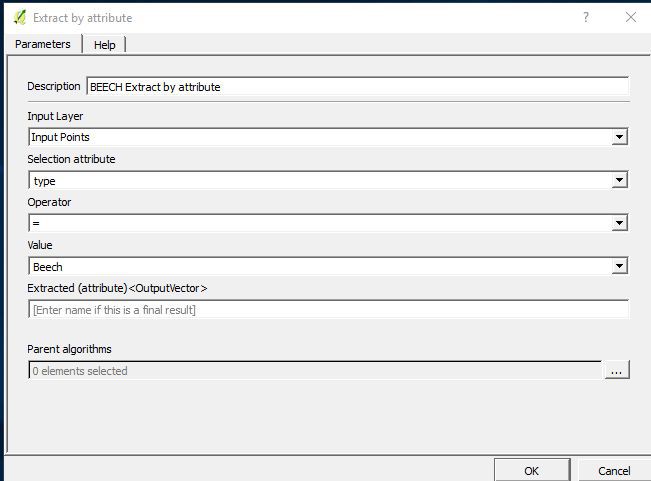
This creates effectively a subset of the input points dataset which can then be counted via the polygons.
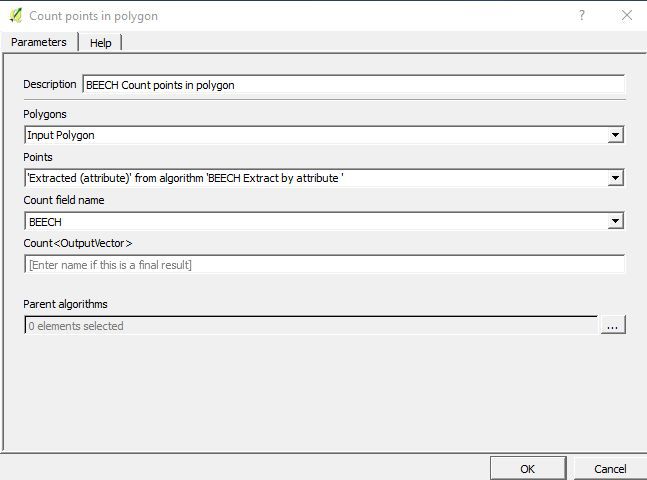
We can then use the count points in polygon to count the number of points that sit inside each of the neighbourhoods.
Count Points in Polygon From Beech Subset of Input Points by Input Polygon, Create field “Beech”
Using standard QGIS this will create a new dataset each time you run an algorithm, but the great strength of the processing modeller is that these intermediate steps can run in the background as temporary layers, rather than confusing your users with multiple layers.
Of course what needs to happen now is that the next iteration (Birch) will need to be counted using the polygon dataset you created for the counts in the Beech dataset. If you think about it, the geography of that dataset is the same as the Input Polygon (the neighbourhoods). It also carries forward all the attributes for the layer as well. So for each iteration you are not using the original input polygons, but adding the new attribute information on for each count.
In the processing toolbox this looks like this:
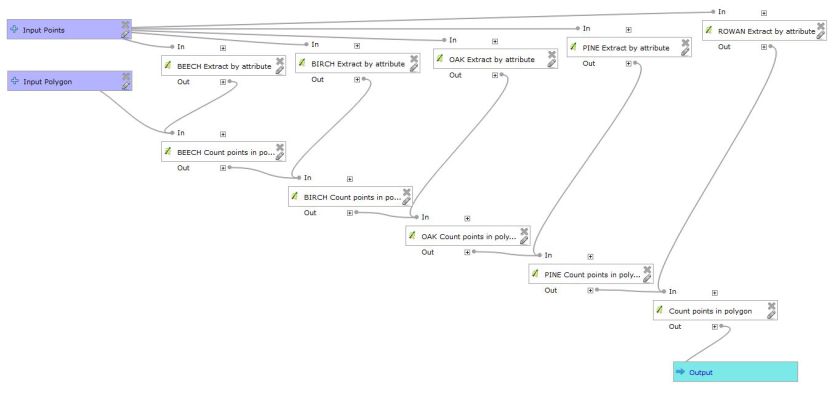
When you run the model, you get a polygon shapefile with a new set of attributes showing the number of each of the tree types in the area. You can then generate graphs or use the data for other purposes.
This is only one of the many ways that the automation tools in QGIS can help you. It is also a really useful system for analysis. QGIS is hugely flexible and has a load of options for this. To learn more and see details of our QGIS training offerings please see our training page.