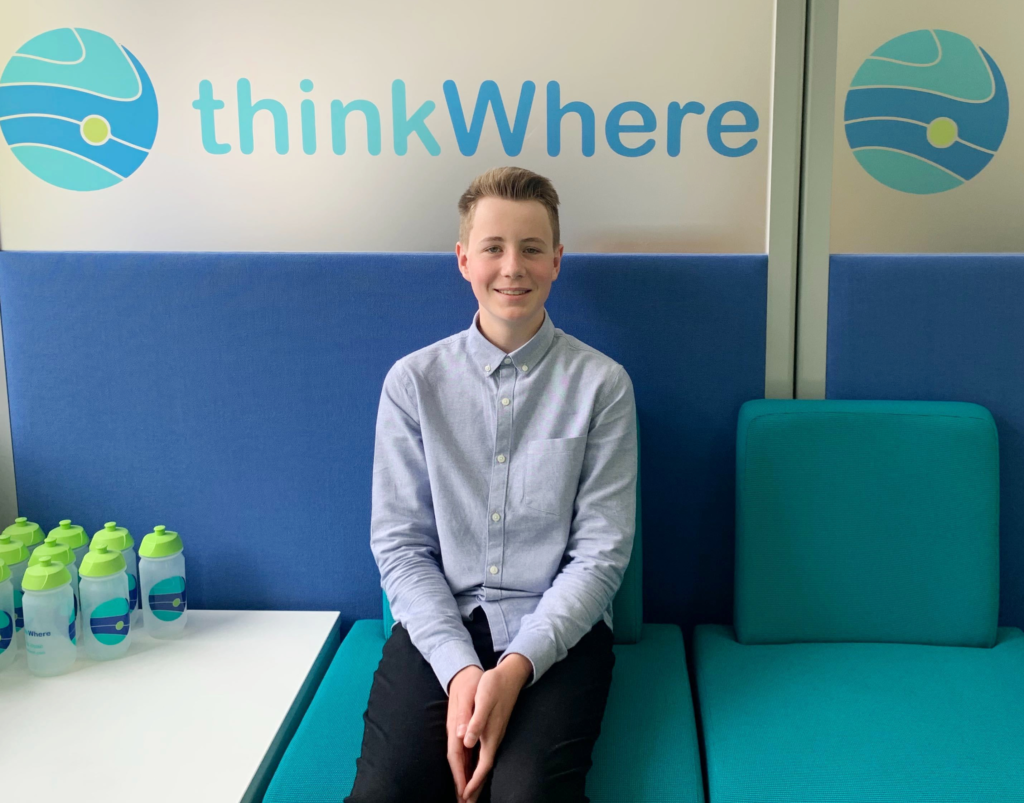
My name is John McNeish, and I’m currently studying at a high school on Arran – a beautiful island on the West Coast of Scotland. In June 2019, I was given a week’s opportunity of work experience at thinkWhere.
I can’t say I’ve ever really loved maps, I just know I find them useful from time to time.
My personal experience of maps? Well, I guess I’m quite familiar with Google Maps and Sat Nav, which we all use to help us find our way around, but apart from that, I’ve never really needed to use them for anything else.
Arriving at thinkWhere, I suddenly found myself in a world of technology…Geographic Information Systems (or GIS) to be precise. I quickly discovered there’s a lot more to “a map” as I know it.
thinkWhere uses QGIS, an open source desktop GIS within their consultancy business. On the surface, GIS shows information visually as a map. However, what isn’t quite as obvious, is what’s tucked away behind the scenes… a system rich in functionality, huge volumes of data, a significant amount of effort and pages of coding. All of these things make GIS the powerful system it actually is.
Let’s start with the data…I’ve found out there’s actually a whole lot of data available! Some of it is free to use (open data), others are licensed on a commercial basis. Different types of GIS data are available…I worked with rasters (images), vector data (points, lines, areas), as well as other types of data such as .csv files. I hadn’t realised that data stored in a GIS is held as individual layers and is “intelligent data”. This means individual features in a layer can store specific information (attributes). Data can be also be linked to other data through attributes, then analysed and easily reported on. Attributes can help show specific themes or patterns in data when they are shown visually on the map. During my time, I saw that GIS can be used to help answer important questions such as “who, when, why and how” in a spatial sense in addition to the “what” and “where”.
Data is at the heart of what thinkWhere does. They maintain and host a massive database of geographic data on behalf of their customers. This means their customers can access hundreds of ready-to-use datasets through thinkWhere’s various products and services. I saw there were numerous complicated processes involved in maintaining a database of digital maps, and the amount of work involved to get data into a ready state.
As for the coding part…it was explained to me that the app the map displays in is coded in Python (a high-level programming language). The web app the user sees is written in HTML (Hypertext Markup Language). Then, different types of Java scripts (a class-based, object-oriented programming language) add dynamic features to the webpage. There are a whole host of other open source technologies used at thinkWhere allowing data to be stored, used, published and shared in a cloud-based environment.
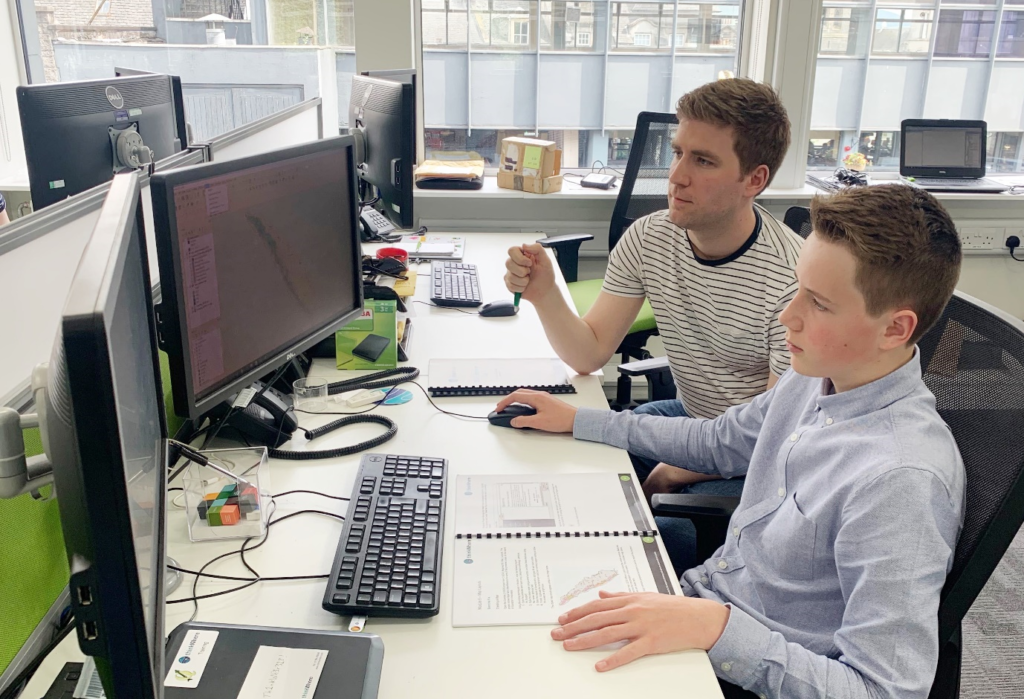
GIS technologies are not taught in my school, so I had to learn everything from scratch including how to Use QGIS and Qfield (for mobile data capture). I found that once you remember what the tools do, and where the menus are in QGIS, everything becomes a lot easier.
Here are some of the maps I made during the week. GIS took me on a virtual island-hopping adventure across the globe – from my own home Arran, Scotland to Sumatra, Indonesia.
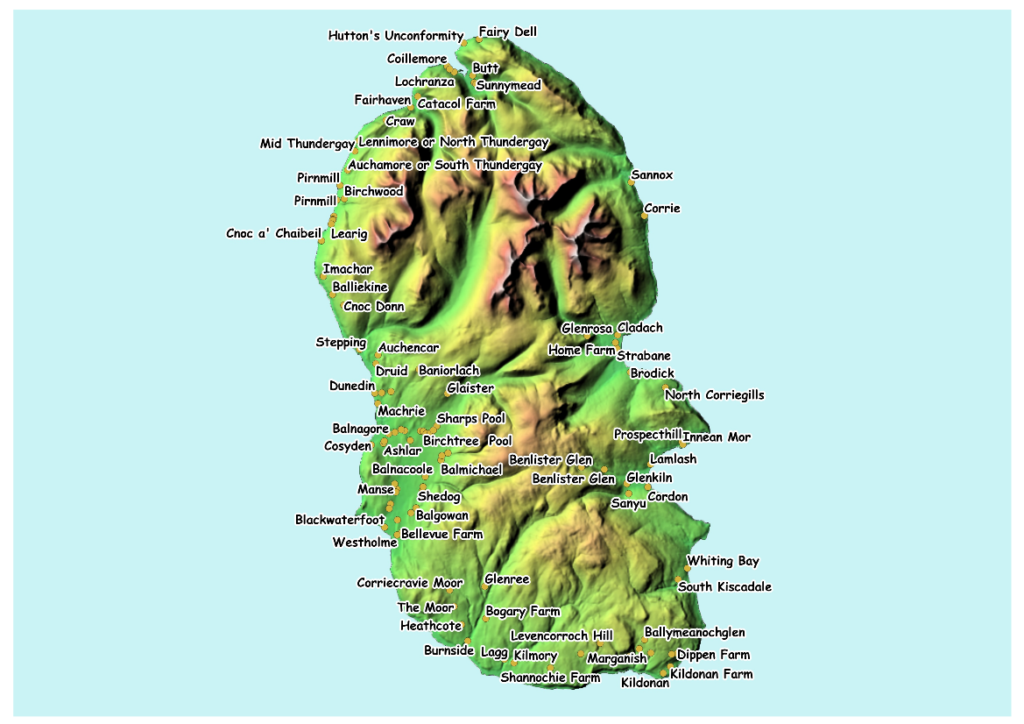
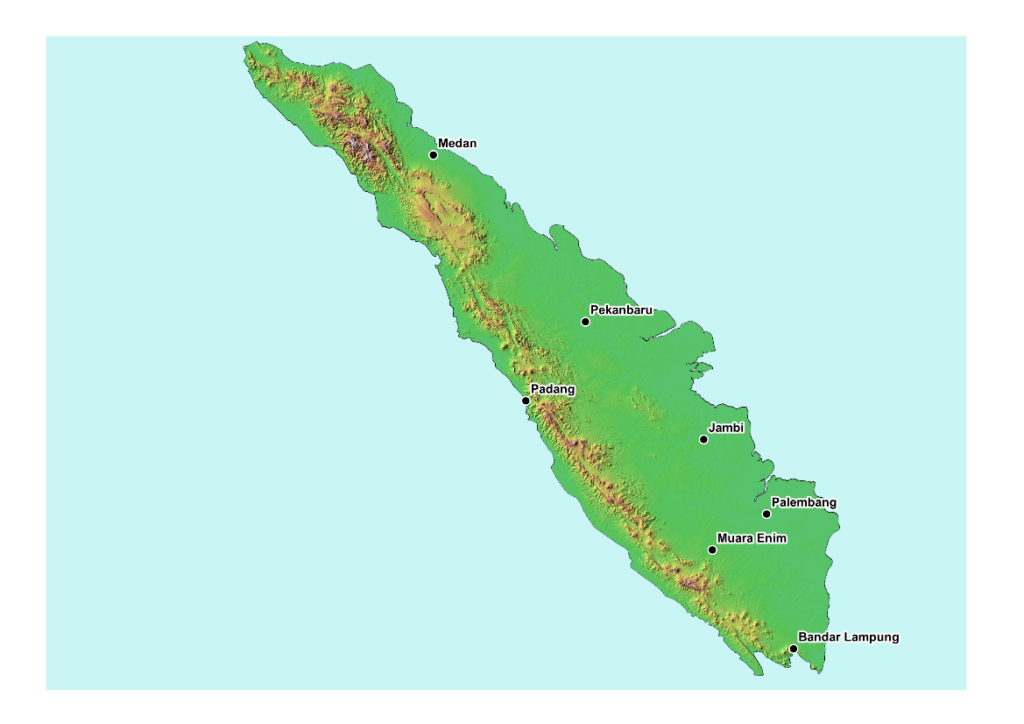
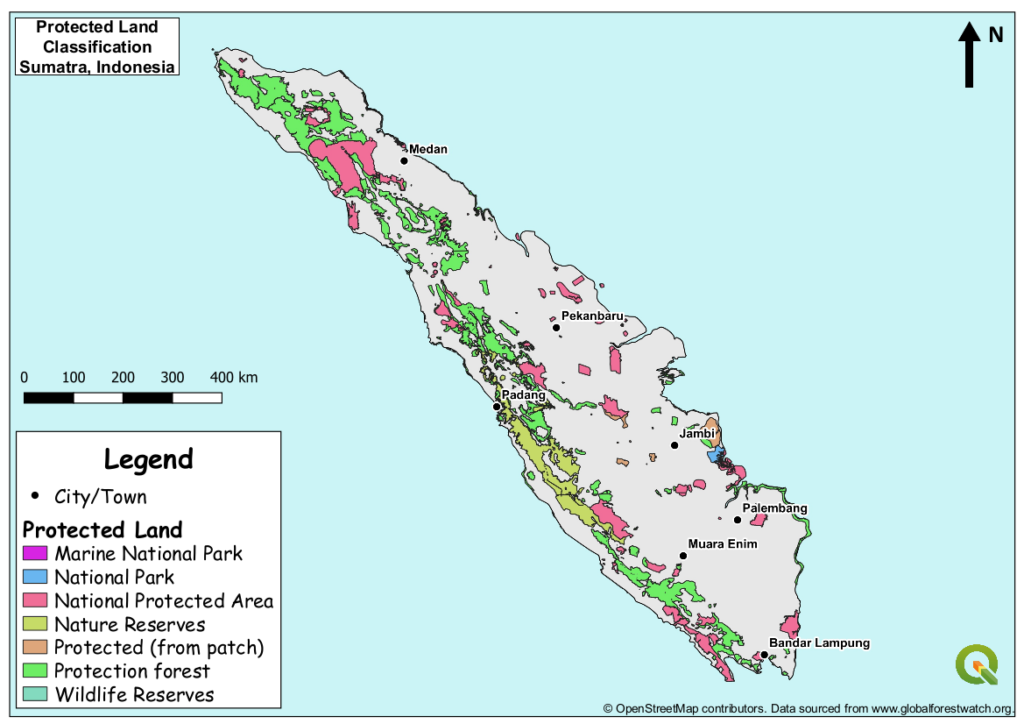
I’m really pleased with my map outputs, and I’d say to whoever thinks maps are boring, you are very wrong.
My time at thinkWhere helped me understand more about them as a business, and how mapping and GIS can be used for important decision-making. I’ve learned things during my week of work experience that will stay with me for the rest of my days, and will help enhance my future career within the Energy Sector.
I’d like to thank the team at thinkWhere for being so kind and welcoming – I really appreciated it.