
Introduction
This blog is going to look at the mathematical calculations involved in rendering 2D GIS vector data, based on a particular area that we want to see on a map. I.e. converting vertices from map space into view space, and back.
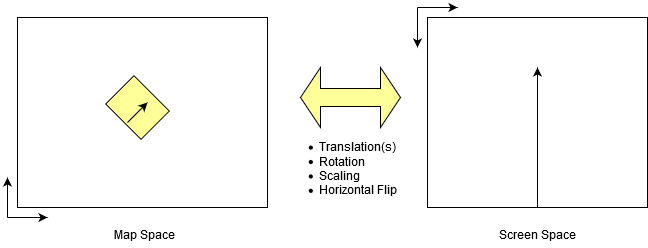
For each vertex in a feature geometry, we need to perform a set of operations to calculate the screen position, based on our chosen location, scale, and rotation. Also, most applications will use top left as the origin rather than bottom left for map projections.
Normally, we would use client software such as OpenLayers, or application software such as GeoServer to make these calculations (and render the points, lines, or polygons) for us, however, occasionally it is more convenient to make the calculations required ourselves. E.g. generation of an image file on a server when the data is not available as a WMS through GeoServer.
At thinkWhere, we have implemented these calculations in a number of programming languages over the years as the languages we have used have changed. We have gone from C++, through C# and Actionscript (Flash), to Python and Javascript.
The Maths
To make the calculations we use Affine Transformations. For 2D data, these take the form of 3×3 Matrices which can be applied to a point location, producing a modified point.
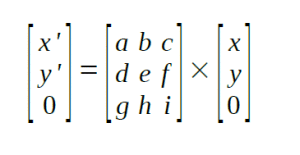
We can create a number of transformations, each of which represents an action on the data. E.g translate, scale, or rotate the point.
![]()
These can be combined through matrix multiplication into a single transformation.
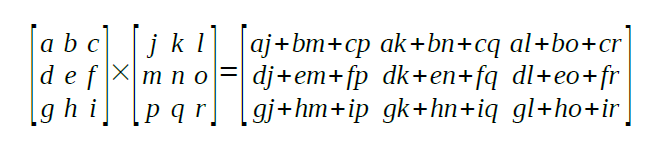
We can also calculate the inverse of a matrix, making it just as easy to perform the reverse set of actions.
The beauty of this approach is that we can apply a number of actions to each vertex in a small number of arithmetic operations making them quick to apply. Even for rotation, the sin/cosine values are calculated once, and the calculated matrix values used in simple multiplications and additions from then on. Once the completed matrix has been generated, the calculations required for each vertex are:
x' = (a * x) + (b * y) + c

y' = (d * x) + (e * y) + f
The Good News
The good news is that once we have created a class to perform the matrix arithmetic, we don’t have to think about it again. We can then create a sequence of actions which will transform our map coordinates to view coordinates.
- Translate the data based on our chosen centre point – centring the data at 0,0
- Scale the data based on our chosen view scale
- Rotate the data around the centre if required
- Flip the horizontal axis to switch the origin from bottom left to top left
- Translate again to the centre of our view (based on the view size)
The example below shows this in action.
Application
This sample application has been written using an HTML5 Canvas to draw a GIS dataset from a GeoJSON file. It uses the turf library to assist in reading the GeoJSON files.
It uses an implementation of affine transformations to calculate the necessary transform to convert map coordinates in the GeoJSON file to screen coordinates. A standard class called CanvasRenderingContext2D draws the features. We have added additional members to make the drawing easier. This object already implements affine transformations. You can apply individual actions using the rotate(), scale(), and translate() methods, which alter the current transformation to allow you to build up a set of actions, or you can supply the six relevant parameters of the matrix in a single call to transform().
We have used the approach of calculating the matrix ourselves, in order to also produce the inverse transformation. This is then used to make the reverse calculation I.e. for a point clicked on the map, find the map coordinate that this relates to in order to then search for the clicked feature within the source data.
The code below uses the view control values to create the required transformation, and pass this to the CanvasRenderingContext2D
function setupTransform(canvas, context)
 {
 var r = document.getElementById("rangeAngle");
 var tx = document.getElementById("rangeCentreX");
 var ty = document.getElementById("rangeCentreY");
 var sc = document.getElementById("rangeScale");
 var scalefactor = canvas.width/sc.value;

var t = new Transform();
 t.apply(new Translate(-parseFloat(tx.value),-parseFloat(ty.value)));
 t.apply(new HorizontalFlip());
 t.apply(new Rotate(parseFloat(r.value)));
 t.apply(new Scale(scalefactor));
 t.apply(new Translate(250, 250));

currentTransform = t;
 currentInverse = t.inverse();
 currentScaleFactor = scalefactor;

context.setTransform(t.matrix[0][0],t.matrix[1][0],t.matrix[0][1],t.matrix[1][1],t.matrix[0][2],t.matrix[1][2]);
/*
alternative method using a combination of the built-in methods
 context.translate(250,250);
 context.scale(scalefactor,-scalefactor);
 context.rotate(parseFloat(r.value));
 context.translate(-parseFloat(tx.value),-parseFloat(ty.value));
*/
 }
When a data file is loaded, the maximum extent of the features is calculated, and the controls are set up accordingly. When the controls are modified the transformation is adjusted, and the features redrawn.
Loops and more
Since it it quite simple to set up a set of actions passing in the various parameters, we can make use of loops to run though a variety of settings and start having some fun.
This example uses the Python libraries: Shapely (to read the GeoJSON data), Pillow (drawing to image), and images2gif (animated GIF) to produce an animated map.